top of page

Data Visualizations

Discover engaging political data visualizations, including interactive maps, charts, and graphs covering U.S. elections, voting trends, party performance, and historical outcomes. Explore insights by year, state, and party to better understand America’s political landscape.

Image by Element5 Digital

2025 Tennessee 7th Congressional District Republican Special Primary Election Results

The Republican special primary for Tennessee’s 7th Congressional District was held on October 7, 2025, to fill the seat vacated by former Representative Mark Green. Trump-endorsed candidate Matt Van Epps won the primary.

2025 Tennessee 7th Congressional District Democratic Special Primary Election Results

The Democratic special primary for Tennessee’s 7th Congressional District was held on October 7, 2025, to fill the seat vacated by former Representative Mark Green.

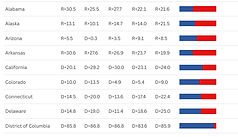
U.S. Presidential Election Results by State: Party Margin of Victory and Average Vote Share Since 2008

View state-by-state U.S. presidential election results from 2008 to the present, highlighting each party's margin of victory and average vote share. Analyze how Democratic and Republican support has shifted across states in recent elections with clear, comparative data.
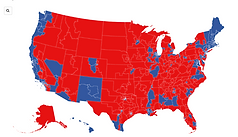
MAPPED: U.S. House of Representatives Election Results 2024

A state-by-state visual breakdown of the November 5, 2024, U.S. House elections. Explore how Republicans (220 seats) and Democrats (215 seats) performed across all 435 districts.

2024 U.S. Presidential Election Results by State: Party Margin of Victory and Average Vote Share

View state-by-state 2024 U.S. presidential election results, highlighting each party's margin of victory and average vote share.

2020 U.S. Presidential Election Results by State: Party Margin of Victory and Average Vote Share

View state-by-state 2020 U.S. presidential election results, highlighting each party's margin of victory and average vote share.

2016 U.S. Presidential Election Results by State: Party Margin of Victory and Average Vote Share

View state-by-state 2016 U.S. presidential election results, highlighting each party's margin of victory and average vote share.

bottom of page